Master Technical Analysis and Trading: A Strategic Guide for 2026 Mastering Technical Analysis and Trading has become one of the [...]
Master Technical Analysis and Trading: A Strategic Guide for 2026
Mastering Technical Analysis and Trading has become one of the most sought-after digital skills for individuals looking to achieve financial independence in Pakistan. In an era where the global economy is shifting toward digital assets and remote work, understanding how to read market trends through Technical Analysis and Trading allows you to navigate the complexities of the stock, forex, and crypto markets with confidence. At Future Skillers, we believe that anyone can transition from a beginner to a professional by learning the science behind price action.
What Exactly is Technical Analysis and Trading?
At its core, Technical Analysis and Trading is the practice of evaluating investments by analyzing statistical trends gathered from trading activity, such as price movement and volume. Unlike fundamental analysts who look at a company’s “intrinsic value” or earnings reports, those who master Technical Analysis and Trading focus on patterns on price charts. They believe that all known information is already “priced in,” and historical patterns tend to repeat themselves because human psychology—fear and greed—never changes.
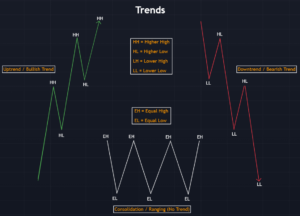
A classic candlestick chart illustrating a bullish trend. Notice how price “bounces” off the support levels—a core concept in technical analysis and trading.
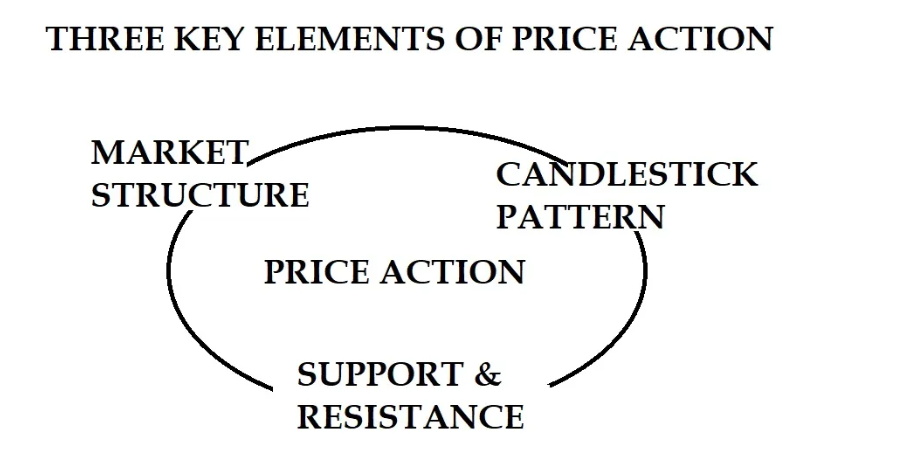
The Three Pillars of Market Analysis
To succeed, you must understand that price moves in trends. In our courses at Future Skillers, we emphasize three main pillars:
Trend Identification: Markets move in three directions: Up (Bullish), Down (Bearish), or Sideways (Ranging). Identifying the trend is the first step in any successful strategy. As the saying goes, “The trend is your friend.”
Support and Resistance: These are psychological price levels where the market has historically struggled to move past. Think of support as a “floor” where buyers step in, and resistance as a “ceiling” where sellers take control.
Technical Indicators: Tools like the Relative Strength Index (RSI) and Moving Averages help traders confirm their theories before entering a position. For example, an RSI above 70 might suggest a market is “overbought,” while a level below 30 suggests it is “oversold.”
Why This is a “Future Skill” in Pakistan
With 68% of Pakistan’s population under 30, we have a massive digital-native workforce. Technical Analysis and Trading allows individuals to participate in global markets from home. It is a borderless skill; whether you are in Lahore, Karachi, or Islamabad, the charts remain the same. This skill provides a powerful hedge against local inflation by allowing you to grow your wealth in a global context.
Risk Management: The Key to Longevity
The biggest mistake beginners make is ignoring risk. Professional Technical Analysis and Trading requires strict discipline. Never risk more than 1% of your capital on a single trade. By using stop-loss orders, you ensure that one bad trade doesn’t wipe out your entire account. Remember, the goal is to stay in the game long enough to let your winning strategy play out.
Join Future Skillers
Mastering these charts takes time, but the rewards are life-changing. At Future Skillers, we provide the mentorship and real-world data you need to turn these concepts into a profitable career. The digital economy is growing—make sure you have the skills to lead it.
Share this article
Follow us
A quick overview of the topics covered in this article.